[ Japanese ]
Building a Foundation for Well-being
Basic Approach
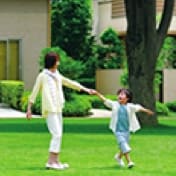
To realize our Global Vision, “Make Home the Happiest Place in the World,” it is essential to make our Company the happiest place for our employees to work. Thus, we want all employees to find happiness. Based on this mindset, in addition to supporting family happiness and promoting health, we conduct the Well-Being Survey to visualize happiness, enabling each employee to pursue it on their own.
Assisting the Pursuit of Family Happiness
Paternity leave
In September 2018, the Group launched a paternity leave program to encourage male employees with a child or children under the age of three to take one or more months off work to focus on childcare.*1 The leave is paid for the first month for all employees, reducing financial concerns for them and their families. To accommodate individual circumstances, leave can be divided into as many as four periods as needed until the child reaches their third birthday. This not only supports employees immediately after childbirth, but also allows for a variety of childcare leave patterns, enabling fathers to coordinate their schedules while their partners reacclimate to work during the nursing period.
Since February 2019, when full-scale operation was implemented, all of Sekisui House’s 2,633 male employees, whose children reached their third birthday (the deadline for taking childcare leave) by January 2026, have taken at least one month of paternity leave, maintaining a 100% take-up rate. We have also maintained this rate of 100% across all Group companies since April 2021. Additionally, the rate of spousal satisfaction with male employees who took childcare leave has grown to 97.8%,*2 proving that this program contributes to the happiness of families.
*1 In the childcare leave system in Japan, in principle, employees may take leave for one year until their child turns one year old, during which time childcare leave benefits are paid. In addition, we allow employees to take childcare leave until their children turn three years old, with the first month being paid.
*2 From the answers of partners on our post-childcare leave survey.
Paternity Leave Usage Rate and Average Days Taken
| Boundary | Unit | FY2023 | FY2024 | FY2025 | Targets | |
|---|---|---|---|---|---|---|
|
Take-up rate for eligible male employee childcare leave (Company standards) |
Group (Japan)*3 |
% | 100 | 100 | 100 | 100 |
| Average days of leave taken | Sekisui House, Ltd. | Days | 32.32 | 33.21 | 33.64 | - |
*3 Sekisui House and major domestic Group companies (excluding Konoike Construction)
Expansion of the paternity leave program
Starting in April 2021, we implemented a more flexible program for taking childbirth-related childcare leave. There were numerous requests from partners in our post-leave survey indicating a need for more flexible leave options. Recognizing the importance of a father’s support during the eight weeks following childbirth—a period of heightened physical and mental burden and increased risk of postpartum depression for mothers—we expanded our childcare leave program to allow leave to be taken flexibly on a daily basis during this period, regardless of the number of divisions.
Ongoing awareness initiatives
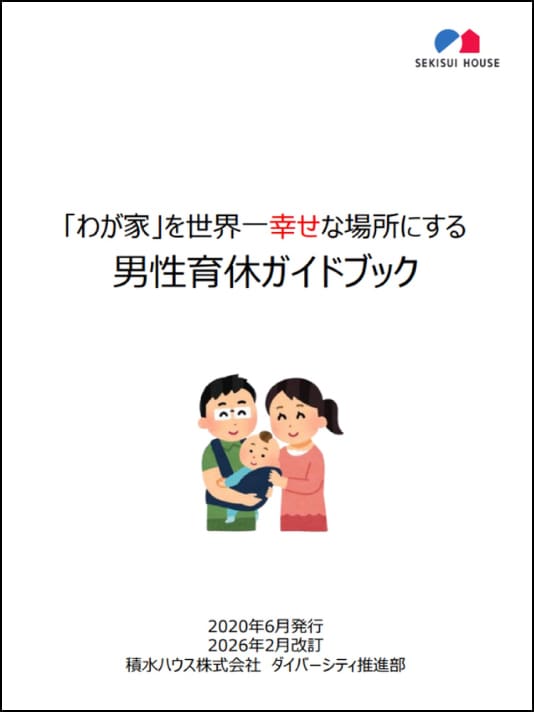
To encourage the taking of paternity leave, we post examples from employees, their families, and supervisors on the intranet. We also publish the Paternity Leave Guidebook, which consolidates information related to paternity leave. Since 2015, we have held annual forums on balancing work and child-rearing, initially catering to female employees raising children and their supervisors. In 2018, we expanded participation in these forums to include male employees raising children.
In 2022, we revised the forum into the Diversity Management Forum, attended by all leaders (primary evaluators*4), to address not only child-rearing but also nursing care and medical treatment, as we strive to create work environments inclusive of all circumstances.
*4 Supervisors whose priority is providing consultations on flexible workstyles for achieving a work-life balance
Family Meeting Sheet
To improve the quality of childcare leave, we developed the Family Meeting Sheet to facilitate communication between spouses on issues such as determining when to take the leave, the purpose of the leave, how to share childcare and housework during the period of leave, and other typical family challenges. The sheet is available on our website for everyone, not limited to Group employees.
Paternity Leave Planner
We have created a tool for workplace communication among those who take childcare leave, known as the “Paternity Leave Planner.” This tool allows employees to coordinate the leave periods determined in the Family Meeting Sheet and discuss who will cover their work duties with their supervisors. This planner also includes a column for partners to sign. This allows the document to be used to receive approval from employees, supervisors, and families, ensuring approval and anticipation of childcare leave.
Initiatives with society
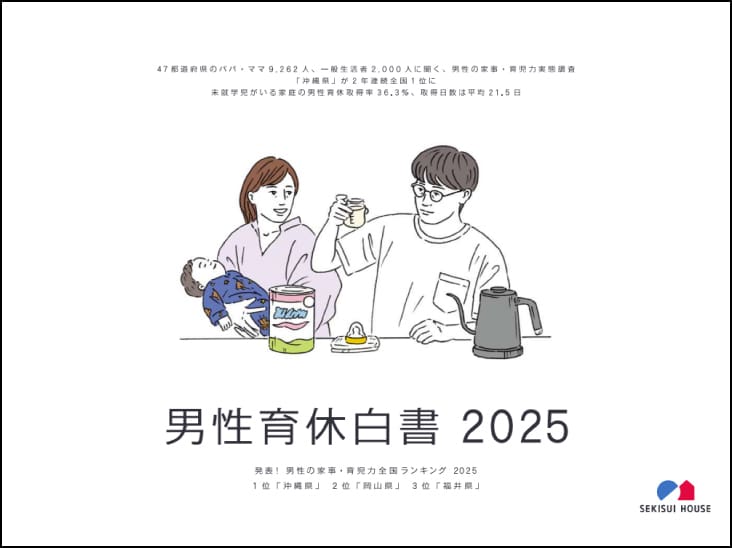
In 2019, we designated September 19 as Childcare Leave Awareness Day. Since then, we have been hosting the annual Paternity Leave Forum*5 on that date to promote awareness of paternity leave in business, government, and education. We have also been issuing the White Paper on Paternity Leave to help make paternity leave the norm in society.
Starting in 2022, we began implementation of IKUKYU.PJT, with the aim of normalizing paternity leave. In 2025, 174 companies and organizations supported us, and we produced videos and shared information about paternity leave. We believe that encouraging paternity leave will help address social issues such as promoting women's participation and tackling declining birth rates.
*5 White Paper Presentation from 2024
Supporting Health Improvement Efforts
We have positioned the maintenance and enhancement of employees’ and their families’ health, which is one source of employees’ happiness, as a key management issue, and are strategically promoting initiatives under the name “Well-Being Management.” Health and productivity management is not only an employee benefit but is also directly linked to the resolution of management issues. We are working to improve presenteeism and absenteeism to enhance productivity and reduce labor losses.
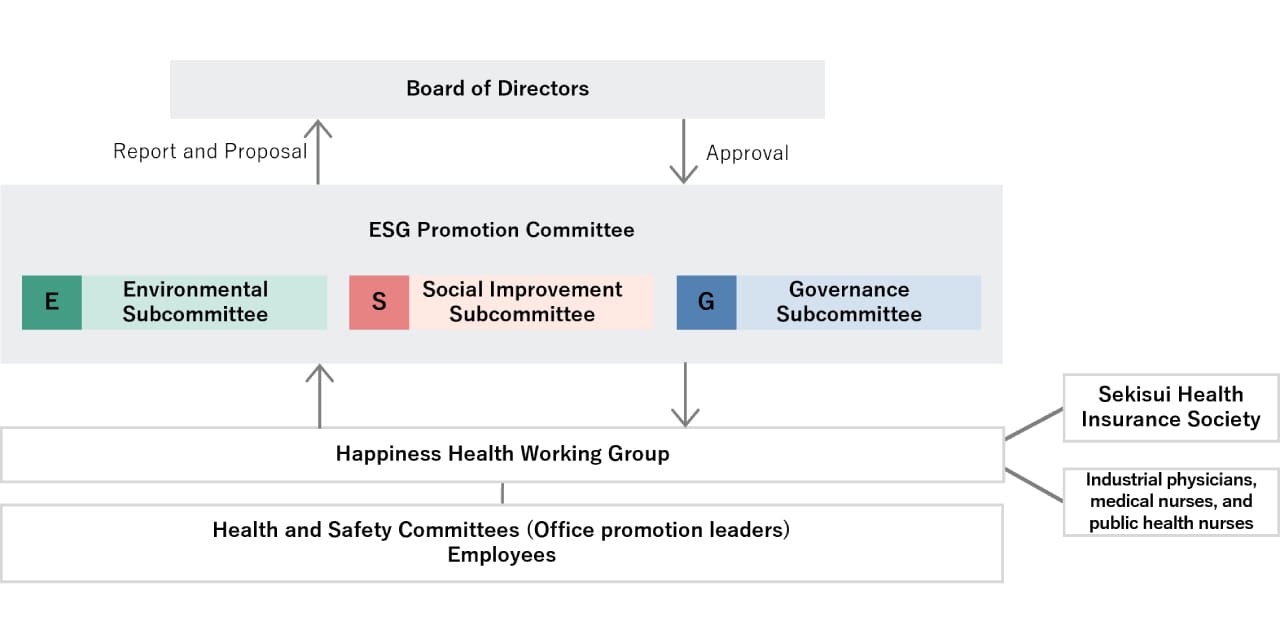
Structure for Promoting Employee Health
Following approval by the ESG Promotion Committee, which works under the Board of Directors, each division works together to roll out the necessary measures.
Strategies
We have formulated a strategic map comprising four pillars—psychological improvement, physical improvement, health awareness improvement, and workplace environment improvement—and are promoting Company-wide initiatives. Please see the Well Being Management website (Japanese only) for details on the strategic map.
Psychological improvement
To prevent any mental health problems in the workplace, we utilize group analyses of stress check results and implement line care training.
Physical improvement
For cancer screenings, we encourage employees to undergo health checks that include items outside of legal requirements. In addition to preventing labor losses from employee leave or resignation, most importantly we believe that early discovery and treatment are essential to ensuring employees’ long-term health and well-being full of vitality. To help our employees stop smoking, we work jointly with the Sekisui Health Insurance Society to provide free smoking cessation programs.
Health awareness improvement
To prevent employee leave and resignation arising from health issues, we keep track of employees’ health and encourage employees who have been advised to undergo reexaminations, detailed testing, or treatment based on the results of their medical checkup to do so. In principle, the Company covers any cost of reexaminations or detailed testing, and allows employees to attend appointments during working hours.
Workplace environment improvement
We believe that enhancing workplace environments can reduce employee stress and improve work-life balance. From a health and productivity management perspective, we are supporting the creation of environments in which it is easy for employees to take leave.
Results and progress
The Group continuously monitors the indicators below and strive for ongoing improvement
Happiness Health Management Metrics
| Boundary | Unit | Targets | FY2023 | FY2024 | FY2025 | ||
|---|---|---|---|---|---|---|---|
| Psychological improvement | Overall Health Risk*6 | Sekisui House, Ltd. | ー | 80 | 87 | 87 | 86 |
| Physical improvement | Cancer Screening Rate*7 | % | 95 | 93.4 | 92.4 |
ー*9 |
|
| Smoking Rate |
Group (Japan)*8 |
20 | 22.8 | 23.2 | ー*9 | ||
| Health awareness improvement | Detailed Examination Follow-up Rate / Treatment Follow-up Rate | 100 | 87.0 | 94.0 | ー*9 | ||
| Workplace environment improvement | Take-up rate for annual paid leave | Sekisui House, Ltd. | 80 | 73.1 | 80.3 | 83.4 | |
*6 Assessment conducted using a chart that measures quantitative workload, control, and manager and colleague support as stress factors.
*7 Lung cancer, stomach cancer, colorectal cancer, cervical cancer, and breast cancer.
*8 Sekisui House and domestic consolidated subsidiaries.
*9 Data will be compiled in November 2026.
Other initiatives
Walking Challenge
Since February 2019, we have held walking events to promote health and wellness and enhance workplace communication through the everyday act of walking. In FY2025, 22,221 people participated, with an average daily step count of 6,933. As a result of these events, the ratio of employees who walk regularly has increased from 44% in 2022 to 47% in 2024. Moreover, the percentage of employees with lipid-related risks has fallen from 18.7% in 2022 to 17.7% in 2024.
| Boundary | Unit | FY2023 | FY2024 | FY2025 | ||
|---|---|---|---|---|---|---|
| Walking Challenge | Participants |
Group (Japan) |
Persons | 21,163 | 21,289 | 22,221 |
| Average step count per day | Steps | 6,652 | 6,957 | 6,933 | ||
Women’s health
Recognizing that health issues unique to women can impact their life stages and careers, we conducted a survey of all female employees in September 2024. We have also created a support system that allows women to easily seek advice, including through an online consultation service.
We also offer an e-learning course on “Women’s Health Care Management,” which is available to all employees regardless of gender, and the participation rate currently stands at 80.9% (23,382 employees).
Continuing the Well-Being Survey
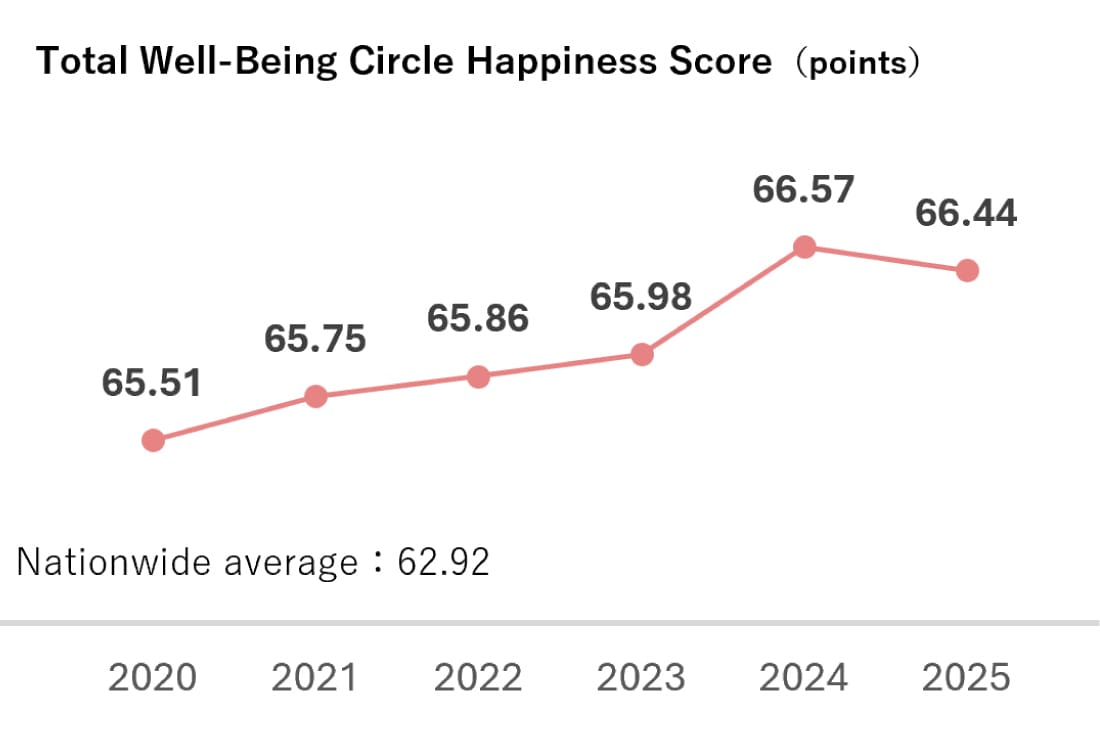
Since November 2020, the Group has conducted the Well-Being Survey to support employees in pursuing their individual happiness. Under the supervision of Professor Takashi Maeno, dean and professor at the Department of Well-Being at Musashino University, special guest professor at Keio University and a leading expert in business administration focused on employee well-being, we became the first company in Japan to undertake and analyze the multifaceted measurement of employee and workplace well-being. The Well-Being Survey consists of 72 questions related to an individual’s happiness, known as the “Well-Being Circle,” and 42 questions related to workplace happiness, known as the “Worker’s Happiness and Unhappiness Diagnosis.” The results of the Well-Being Circle are quantitatively measured across 34 items in 11 categories, and in the Worker’s Happiness and Unhappiness Diagnosis across 14 items in 2 categories. By using this method to visualize well-being, we can connect the survey’s results to concrete plans for pursuing happiness for individual employees.
Results of the FY2025 Well-Being Survey and key insights
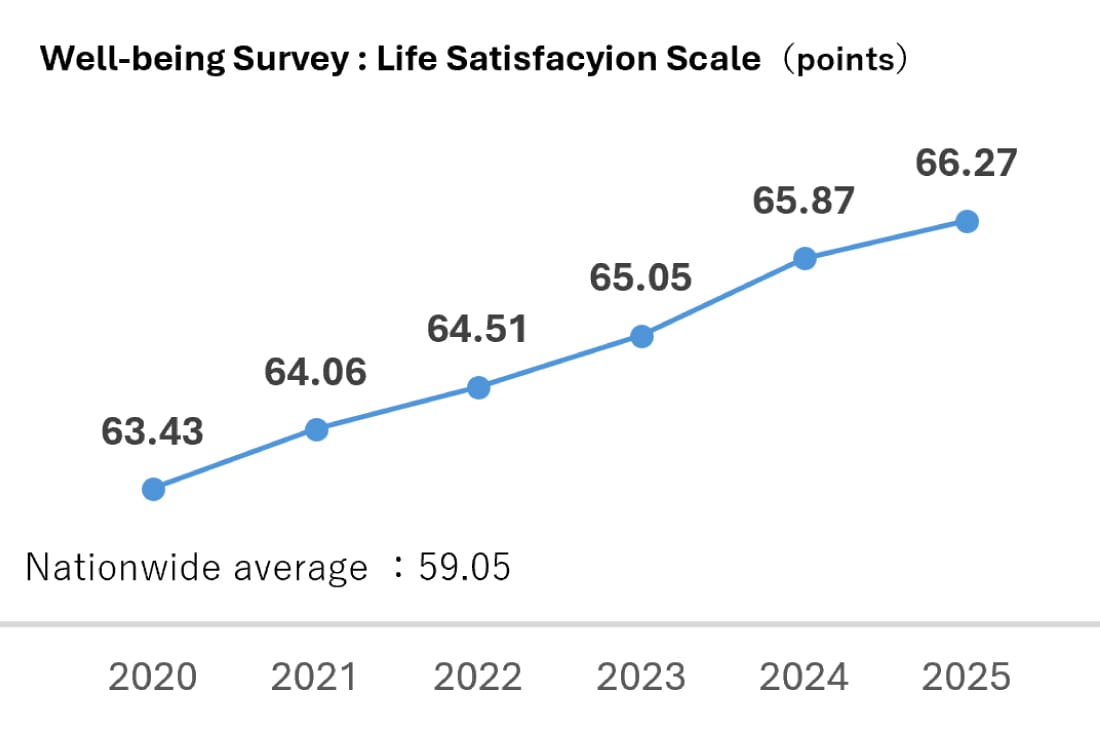
According to the results of the six surveys we have conducted since FY2020, the total value of the Group’s employees’ Well-Being Circle was higher than the nationwide average each year, and has increased by approximately one percentage point since we began taking the survey. We were rated much higher than the nationwide average in the categories of Well-Being and Gratitude according to the FY2025 survey. Our high Gratitude score indicates that our fundamental Corporate Philosophy of “Love of Humanity” is well integrated within the Company. By item, our score for “Life Satisfaction Scale,” a measure of medium- to long-term happiness, was significantly higher than the nationwide average, and increased for the fifth consecutive year. These results demonstrate our steady progress toward the fulfilment of our Global Vision.
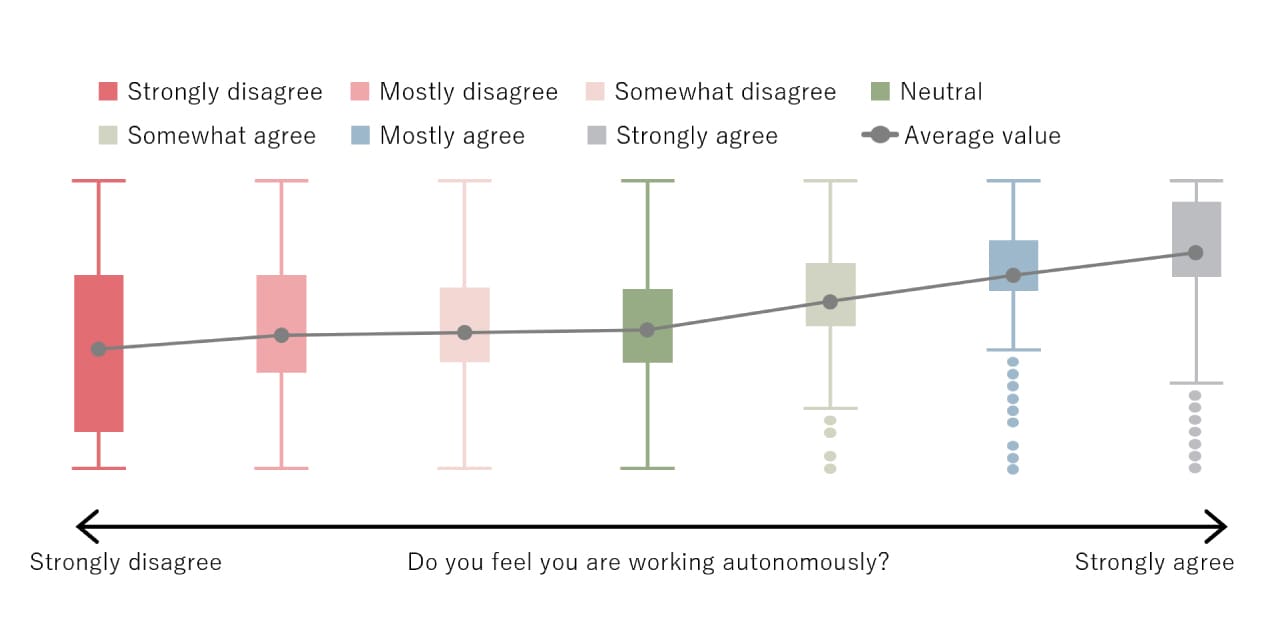
Since FY2023, we have also been examining how “employee autonomy,” one aspect of the Group’s human capital value, relates to the survey results.
The results revealed a correlation between responses to the question “Do you feel you are working autonomously?” and every item in the Well-Being Survey, indicating that those who perceive themselves as working autonomously tend to report higher levels of happiness. Going forward, we will integrate our Group’s initiatives into the Well-Being Survey to verify their effectiveness and pursue improvements.
Life Satisfaction Scale×Autonomy
Initiatives utilizing the results of the Well-Being Survey
Visualizing the Well-Being Survey
The results of the Well-Being Survey for each individual employee, as well as the results for the employee’s affiliated office, are disclosed only to the employee concerned. Group-wide results are made available to all employees via the intranet. We are connecting the results of the Well-Being Survey, along with comparisons to previous years, to discussions toward helping each employee with individual and workplace well-being.
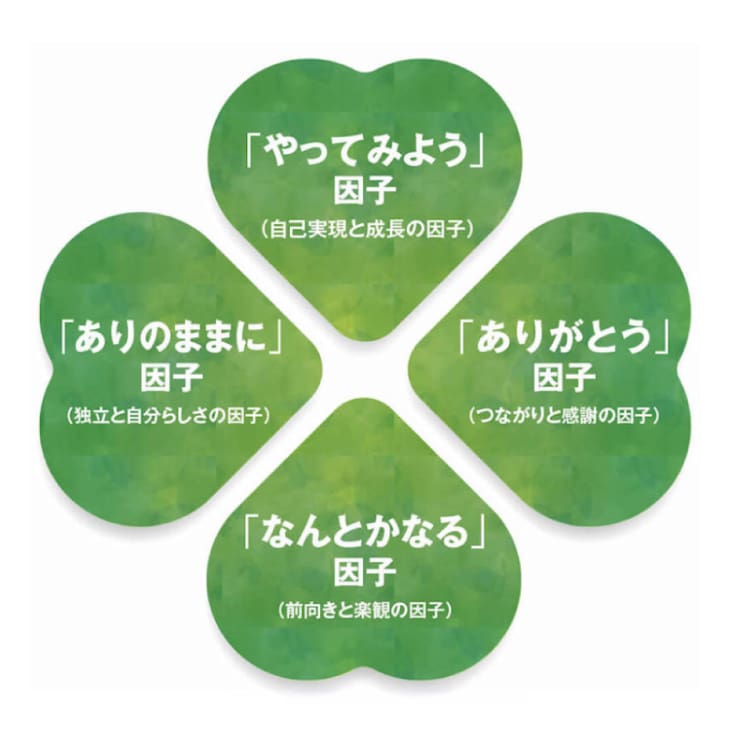
Four Happiness Factors
Discussions on well-being
In FY2025, after an e-learning course on the basics of happiness, participants formed small groups of four to five people and used the results of the Well-Being Survey to discuss their individual organization’s strengths and initiatives to develop these strengths further. Through these discussions, the aim is to equip employees with the four factors required for happiness and have them independently implement the relevant initiatives to autonomously build happier workplace environments.
Moreover, a feedback survey completed by approximately 9,000 employees from our domestic Group companies participating in these discussions showed a high satisfaction rating of 4.12 on a five-point scale (3.97 in 2024). Participants have also commented that taking time to reflect and talk about their own and their workplace’s happiness has helped to deepen communication and promote self-understanding and self-growth.
Well-being Creation Prize
To commend initiatives and ideas related to well-being, we began our initiatives in FY2025 to present the “Happiness Creation Prize,” selecting winners from among the ideas submitted to the Sekisui House Innovation & Performance (SHIP) Awards.
In the 4th SHIP Awards, we selected two winners from among the many ideas submitted.
- “The World’s Happiest Home Painting Contest” An idea centered on children’s well-being
- “Energizing Everyone with Visible Happiness Information!” An idea to capture and display moments of employee and customer happiness in the workplace